Part Four: Chimneys, Lasers Chart Faults
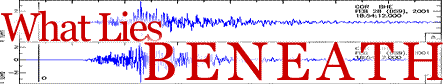
While core samples have been a key to the mapping project's success, the Nisqually quake was a boon, too. In the weeks following the tremor, Booth and Troost, along with researchers from the UW, USGS, and Western Washington University, combed the streets of Seattle and Bremerton looking for chimney damage. After surveying 50,000 to 60,000 chimneys, they catalogued more than 1,500 structures with damages ranging from simple cracks to total collapse.
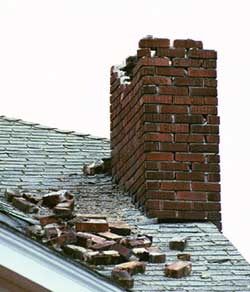
A house in West Seattle shows chimney damage caused by the Nisqually earthquake. Photo by John Shea, FEMA News Photo.
"We were not surprised to see the damage, as we knew that widespread chimney failure occurred during the 1965 Seattle earthquake, but we were surprised by the pattern," says Booth. Chimney failure occurs in a swath from Bremerton through West Seattle, South Park, and Beacon Hill, which corresponds nearly perfectly with the Seattle Fault zone, which lies directly under the city in those neighborhoods.
"The Seattle Fault did not move but may have acted as a lens, focusing seismic energy along a boundary between the two sides of the fault," says Booth. On the south side sits harder bedrock, which has slowly pushed up about 5 miles over the last 10 million years, while softer sediments lay north of the fault. He speculates that the change in geology affected the seismic waves, possibly refracting them upward-like light being bent in a glass of water-or condensing the waves, making them larger and causing the shaking to intensify.
He cautions, however, that this model does not explain all of the data. "We do not know why so much chimney damage occurred in the Madrona and Green Lake areas," says Booth. "What is important about this data is that it helps us understand where damage occurs and how severe it can be."
In addition to ground data, the researchers will also map the land from above, using recently available technology called LIDAR (Light Detection and Ranging). LIDAR uses rapid pulses of laser light emitted from a low-flying (4,000 feet) airplane to precisely measure surface topography. Described by one researcher as "virtual deforestation," because it maps the land as if no trees existed, the technology has led to the discovery of gullies and traces of faults on Bainbridge Island that no one had previously mapped.
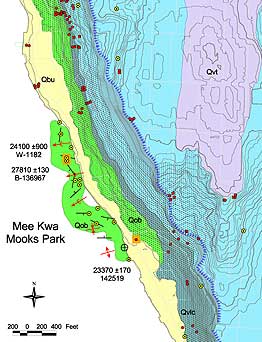
A detail from the new Seattle geology map shows landslide dangers in West Seattle.
Booth and Troost's first map, the West Seattle quadrant, will be available in hard copy and on-line later this year. In contrast to the black-and-white Waldron map, the modern one beautifully displays the surface geology in subtle shades of teal, chartreuse, lavender and charcoal.
Along with showing the lay of the rocks, the map provides a basis for understanding the geologic processes affecting people and landscape. At Mee Kwa Mooks Park, on the west side of West Seattle, for example, royal blue chevrons delineate the vertical faces of the uppermost cliffs. A line of red dots outlines zones susceptible to landslides, while green triangles mark where historic landslides took place. Red dots also wind into the hills above the park, showing how landslides have eaten away at what had been horizontal beds of glacial sediments.
On the shoreline is a pale green zone, which shows the beds that Troost and Booth waited several months for the right tide conditions to expose. Orange squares indicate where they found exposure of rocks at the surface. The Waldron map does not even recognize this unit.
And finally, those with access to the digital edition of the map will be able to click on one of many yellow circles to display bore cross sections, bringing to light the subsurface anomalies.
Booth and Troost are also focusing on practical information on the rocks. They are standardizing nomenclature so geologists will speak the same language; determining age and identification of geological units; and describing in detail these units' properties, such as strength, thickness, source and liquefaction potential.
Go To: Page 1 | Page 2 | Page 3 | Page 4 | Page 5
- Sidebar: The Quake on Montlake
- Return to June 2001 Table of Contents